

| Standard electricity billing unit | Kilowatt-hour (kWh) (U.S. Energy Information Administration) |
| Standard natural gas billing unit | Therm (U.S. Energy Information Administration) |
| Demand charge measurement window | Typically 15 or 30 minutes (Varies by utility rate plan) |
| Bill sections to review for waste signals | Usage history, rate tier breakdown, supply vs. delivery split |
| Most reliable usage comparison method | Same month, prior year (removes seasonal variation) |
What Your Bill Is Actually Telling You
Most homeowners glance at their utility bill, check the total, and move on. But the pages behind that number contain usage data, rate breakdowns, and comparative charts that can pinpoint exactly where energy is escaping your home. Learning to read those details is the first step toward meaningful, lasting reductions in what you pay each month.
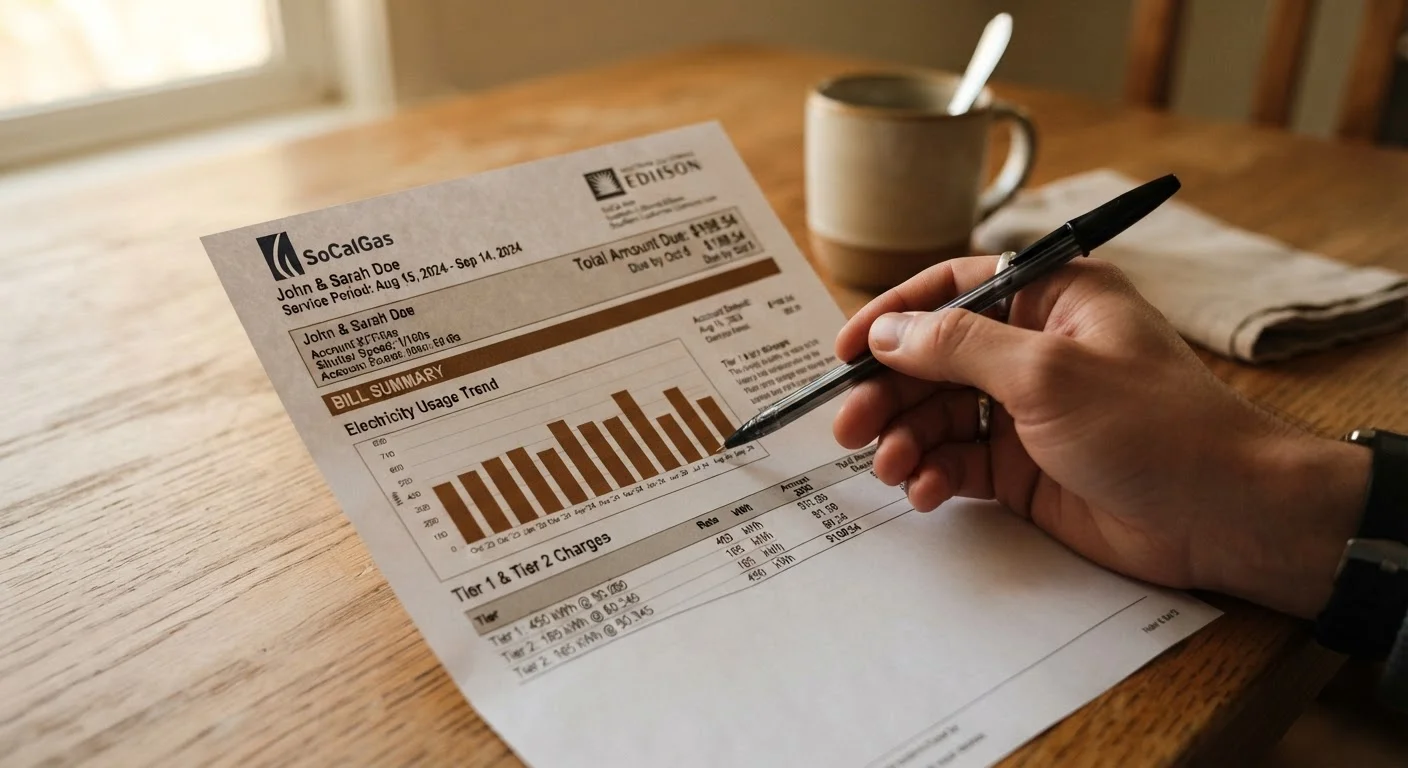
A standard electricity bill from a US utility typically includes several distinct sections: the account summary, a usage history graph, an itemized rate breakdown, and — for many utilities — a neighbor comparison tool. Each one tells a different part of the story. Similarly, a natural gas bill includes therms consumed, the delivery charge, and a supply charge that can fluctuate by season.
If you want to go deeper after reviewing your bill, a professional home energy audit can turn suspicions into confirmed data points with specific remediation steps.
kWh (Kilowatt-Hour)
The standard unit used to measure electricity consumption. One kWh equals one kilowatt of power used continuously for one hour. Your bill's total usage is expressed in kWh.
Tiered (Inclining Block) Rate
A pricing structure where the cost per unit of electricity increases as your total monthly usage crosses set thresholds. Consuming more than the baseline amount triggers a higher per-unit price for the excess.
Demand Charge
A fee based on your single highest peak energy draw during a billing period, measured in short intervals (often 15–30 minutes). It reflects the strain placed on the grid at maximum load, not just total consumption.
Therm
The unit used to measure natural gas consumption on utility bills. One therm equals approximately 100,000 BTUs of energy.
Delivery Charge
The portion of your utility bill that covers the cost of transporting energy to your home through pipelines or power lines. This charge is largely fixed regardless of how much energy you use.
Supply Charge
The portion of your utility bill representing the actual cost of the energy commodity — electricity or gas — consumed. This is the component most directly affected by your usage habits.
The Billing Numbers That Signal a Problem
Not every line item carries equal weight. Here are the figures worth examining closely:
kWh Usage vs. Same Month Last Year
Utilities commonly print a 12-month usage bar chart on the bill. If your usage for a given month is significantly higher than the same month the previous year — without an obvious reason like a new appliance or an extra person in the house — that gap is a signal worth investigating. Year-over-year comparison removes seasonal variation, making it a more reliable indicator than month-to-month swings.
Tiered Rate Thresholds
Many utilities use tiered pricing (also called inclining block rates), where the cost per kWh increases once you cross a usage threshold. For example, the first 500 kWh might be billed at a lower rate, with every kWh above that charged at a premium rate. If your bill consistently lands in the highest tier, even modest reductions in usage could push you into a lower rate band — delivering a compounding benefit. Check your rate schedule, usually printed on the bill or available on your utility's website.
Demand Charges (for Some Customers)
Some utilities — particularly those serving small businesses, but occasionally residential customers on certain rate plans — apply a demand charge based on your highest 15- or 30-minute usage peak during the billing period. A single afternoon running the AC, oven, and dryer simultaneously can set your demand charge for the entire month. If your bill includes a demand charge line, spreading out high-draw appliance use across the day can lower that figure meaningfully.
Delivery vs. Supply Charges
Your bill typically splits costs between supply (the energy itself) and delivery (moving it to your home). Delivery charges are largely fixed — you have little control over them. Supply charges are where your usage habits have direct impact. Understanding which portion is which helps you set realistic expectations about how much your behavior can actually move the needle.
For context on how similar line-item thinking applies to other household spending, see the room-by-room grocery spending breakdown for a comparable approach to uncovering hidden costs.
Turning Bill Data Into Action
Once you've identified an anomaly — a usage spike, a tier overage, or an unusual demand charge — the next step is tracing it back to a source. The most common culprits are HVAC systems cycling inefficiently, water heaters running continuously, and electronics drawing power around the clock. Our guide to hidden energy drains around the house walks through where these loads tend to concentrate.
Also worth checking: whether any widely repeated efficiency habits are actually working against you. Some conventional wisdom about thermostats and appliances doesn't hold up under scrutiny — the energy efficiency myths article separates evidence-based practices from those that waste time or money.
Your utility bill is a free diagnostic tool delivered to your door every month. The homeowners who use it that way — rather than just as a payment notice — tend to find that their usage trends in a more manageable direction over time. No specialized equipment required; just a closer read of what's already there.
This article provides general informational guidance about understanding utility billing structures. It is not a substitute for advice from a licensed energy professional or your utility provider regarding your specific account or rate plan.